Unlocking the real-time aid potential of the CRS with IATI data
IATI is an incomplete, but up-to-date source of data on international assistance flows. Here’s how it can be used with the OECD DAC CRS to get a better global picture of where money is flowing now.
Background
The OECD’s Creditor Reporting System (CRS) is the definitive source of data on international assistance flows. It is a donor-reported system that comprehensively covers official development assistance (ODA) across 49 sector codes and 155 recipients for all DAC donors, as well as most large multilateral institutions and some private foundations. A large part of what makes the CRS so trustworthy is the extensive data validation undertaken by the OECD after donors submit their data. The OECD verifies the flows, corrects data errors, and validates the submission for completeness of key data fields. While vital to the accuracy of the CRS, this step also introduces a significant time delay in the publishing of the data. In April of any given year, the OECD publishes aggregate level preliminary ODA data for the prior year. By December, the final detailed data is released. This means we need to wait until December 2024, or 23 months, before we have access to project-level data for January 2023.
On the flip-side of the coin, the International Aid Transparency Initiative (IATI) is a voluntary data standard that allows donors to immediately report and publish their development flows. Each donor retains ownership of their own IATI data and it is not subject to any formal third-party verification system before being published. There are over 1,600 individual organisations publishing to IATI, but about 60% of them are small NGOs. Many of these NGOs are not tracked in the CRS because their financial inputs are already accounted for in the contributions of bilateral and multilateral donors. Because IATI is voluntary, not all major donors are accounted for; only 73 donors tracked by the CRS are also publishers of IATI data. As a result, IATI is a good source of data for interrogation of ODA from any particular donor that publishes to the standard, but it alone cannot give a full picture of the international assistance landscape.
In order to capture the best of both data sources - a complete, near-real time, and accurate picture of aggregate ODA flows - I have developed a methodology to combine CRS and IATI data into a time-series nowcast of development finance.
Methodology
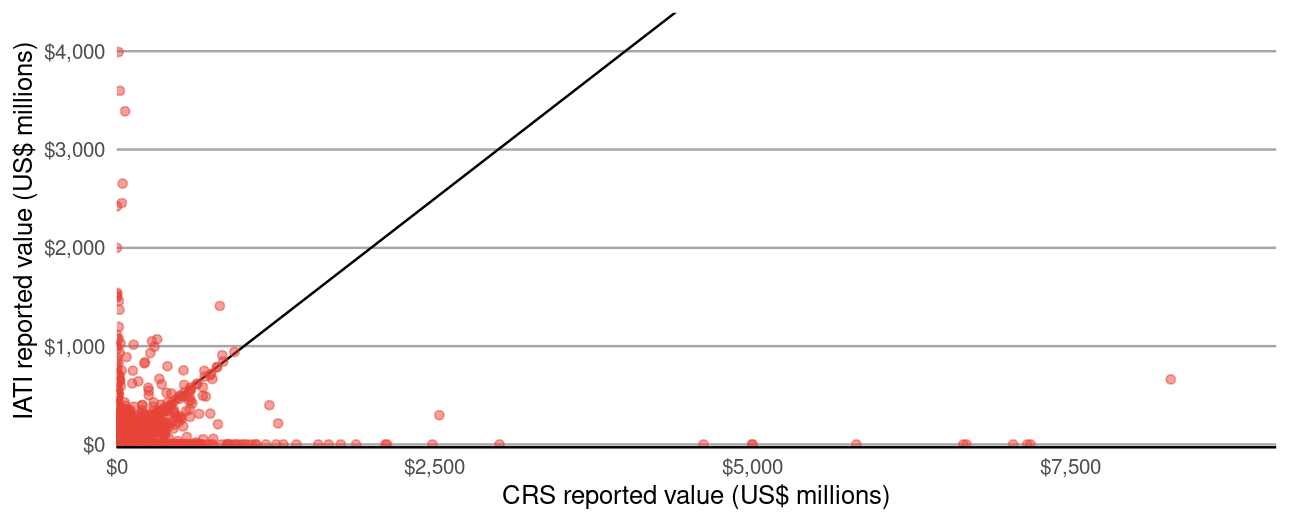
The first step of the methodology is to bring the two data sources into a comparable state. IATI data is split into atomic units representing transactions to a single recipient and single sector before being converted from national currency units (NCU) into current USD. This is done by taking transaction-level sectors and recipients from the IATI XML where available and imputing the transaction-level by applying activity-level sector and recipient percentages where transaction-level is not available. Next, a dictionary containing IATI reporting organisation reference codes and OECD donor codes is applied to the IATI data. IATI transactions that were published by organisations not also tracked by the CRS are dropped from the dataset. The IATI and CRS data are each aggregated by year, donor, recipient, and sector before being joined together into a single dataset. Once joined, the data look like this:

The black line in the middle of the chart represents the 45-degree line; points that lie on the line are where year/donor/recipient/sector combinations have the same reported value for both IATI and the CRS. For example, one point represents the total amount the United States gave to Afghanistan for the secondary education sector in 2016, and another represents the total amount given from the United Kingdom to Benin for environmental protection in 2019. The projects are reported to both CRS and IATI, but points below the line represent combinations where a greater value was reported in the CRS and points that lie above the line represent where a greater value was reported in IATI. While some points lie on or near the line, many lie far from it, showing that the reported values from these datasets are not fully comparable. We cannot just take the 2023 aggregate values from IATI and use them to estimate the aggregate CRS values without first transforming them.
Technical explanation
In order to transform the IATI data in a way that makes it useful for nowcasting aggregate CRS values, a time-series model of CRS funding was developed. The model is formulated such that an aggregate year, sector, and recipient ODA amount reported in the CRS is a function of the amount for the same aggregate reported to IATI in the same year, plus the same aggregate reported to CRS for the prior year, plus the absolute change in the IATI aggregates from the prior year to the current year. For validation, the model was fit using the joined data from above for the years 2016 to 2021, and the root mean-squared error (RMSE) was calculated by comparing the projected CRS value for 2022 to the known value. Models with lower RMSE indicate better fit. The results of the model are below:
| Characteristic | Beta | 95% CI1 | p-value |
|---|---|---|---|
| usd_disbursement_iati | 0.12 | 0.11, 0.13 | <0.001 |
| usd_disbursement_crs_t1 | 0.89 | 0.88, 0.89 | <0.001 |
| delta_iati | 0.20 | 0.19, 0.22 | <0.001 |
| No. Obs. = 48,805; Adjusted R² = 0.830; p-value = <0.001 | |||
| 1 CI = Confidence Interval |
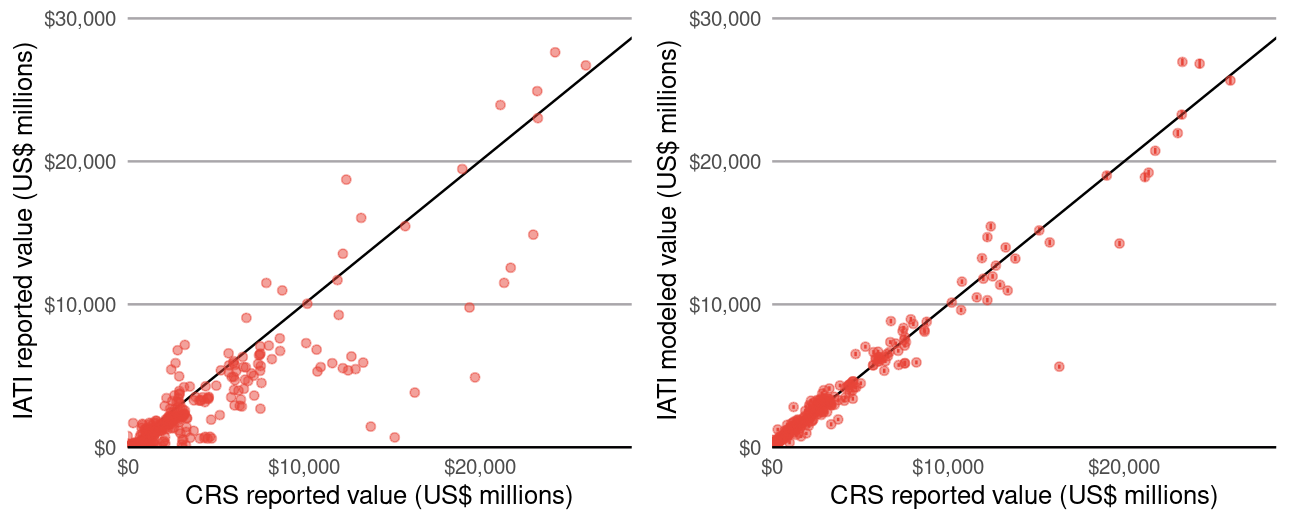
An adjusted R-squared of 0.83 indicates that over 80% of the variation in CRS values can be explained through the auto-regressive CRS component and the IATI components of the model. At this level of aggregation, the untransformed IATI data had an RMSE of 126.9 while the model was able to improve it to 109.5. Most impressively, aggregating the estimated CRS values to year and sector combinations after modelling yields a reduction in RMSE from 2966.3 down to 1458.5. The fit of this year/sector aggregation level can be demonstrated by two side-by-side scatter plots.

As before, the black line in the middle represents the 45-degree line. The chart on the left shows the fit of IATI data to CRS data before modelling, and the chart on the right shows the fit after modelling. Although still an imperfect estimate, it’s clear the modelled IATI data clusters much closer around the 45-degree line, showing that IATI data can create accurate predictions of yet-unpublished CRS flows.
Process and lay explanation
For years prior to this point, the best way I had of estimating up-to-date development assistance flows was by looking directly at the values published to the IATI Standard. Development Initiatives first practical use of this technique was in the “Tracking aid and other international development finance in real time” dashboard. That dashboard overcame some of the faults of IATI data highlighted in the background of this blog by making a subjective assessment of which DAC donors had accurate and timely reporting and limiting the analysis just to those donors. The real time aid dashboard worked for a donor-centric view of aggregate aid, but did not allow a sector or recipient-scale analysis.
When tasked with developing an estimate of real-time aid to food sectors for recipient countries experiencing food crises, my next logical step was to develop a model of the relationship between the scale of values reported to the CRS and those reported to IATI.This first model was very simple and worked by finding the constant multiplier that minimised the historical differences between the two data sources. Small constant differences for each sector and recipient (called fixed-effects) were added to account for cases where some sectors or recipients always had larger differences than the average.
As a prerequisite to developing the first comparison model, I had a large scale dataset of comparable CRS and IATI data across almost a decade of historical development flows. With this dataset, I learned that the best predictor of a CRS value for a given year, sector and recipient was the value for the same sector and recipient from the prior year; but if you try and estimate current year values using only the prior year, you end up with a model that is not capable of anticipating changes in trends over time. This is where my idea for adding the current IATI value and the change in IATI over time to the model came from. The model takes the previous CRS value as a basis for a prediction, but then adds in the information in changing global trends through the reported changes observed through the IATI data.
Conclusions
The CRS and IATI are both valuable data sources for researchers and practitioners trying to gain a better understanding of ODA. Although modelling data leads to a dependence on the model assumptions and a reduction in interpretability, I hope I have demonstrated that it may be our best method at the moment to achieve a timely and comprehensive picture of global development assistance.
The code used to generate the models, charts and tables in this blog post, as well as the pre-joined data are available at my Github repository here: https://github.com/akmiller01/crs-iati-blog